Skills Measured in Tableau for Certification Many skills are measured before one can obtain a Tableau Certificate. However, connecting to data and preparing data is the most basic requirement. To split it into categories we can say that it comprises of the below three: Create and Save data connections Modify data connections Manage data properties […]
Tag: tableau
Bubble Chart: Creation & Importance
Bubble chart is also known as a packed bubble chart in tableau. It is used to show data in bubbles or filled color circle with various sizes. If you wish to display your data in the formed cluster of circles, then the bubble chart is the best option for you. Every value in the dimension […]
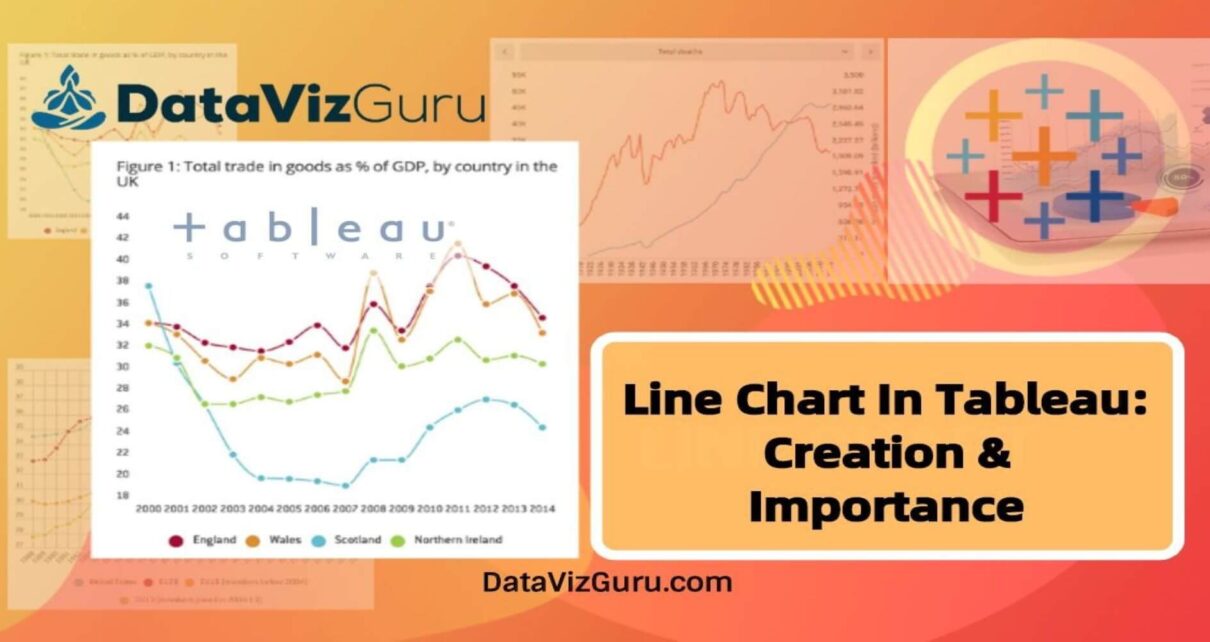
Line chart in Tableau: Creation & Importance
A line chart, As the name suggests, a line chart is simply a reflection in the form of a line. This line is formed by connecting the individual data points in a view. It is a simple visualization of values and are useful when you want to see trends over time, or to forecast future […]


