A line chart, As the name suggests, a line chart is simply a reflection in the form of a line. This line is formed by connecting the individual data points in a view. It is a simple visualization of values and are useful when you want to see trends over time, or to forecast future values and typically requires numeric values plotted as lines.
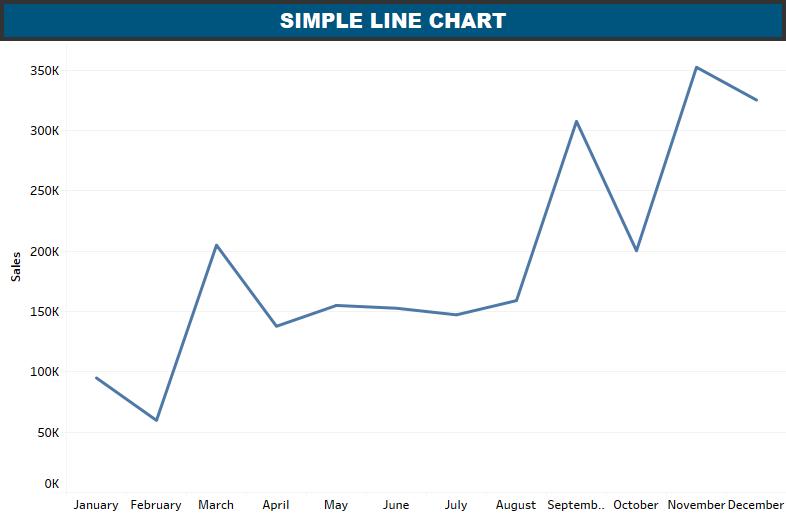
A line chart is created using a dimension and a measure at any of the axes. Generally in tableau, a line is automatically created and displayed if you use any date dimension on the rows or the columns. However, you can convert any other chart to a line chart in the tableau by using mark cards.
Let us create a line chart:
Simple Line Chart
If you want to see an automatic line chart you can use a date value into dimension and sales to rows.
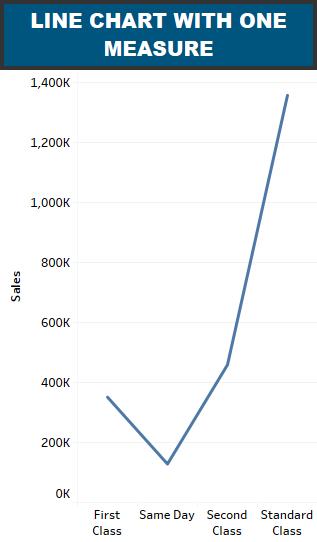
Another way to create a line chart is to choose one dimension and one measure from the data pane. Drag the dimension Ship Mode to Columns Shelf and Sales to the Rows shelf. Choose the Line chart from the Marks card. You will get the following line chart, which shows the variation of Sales for different Ship modes.
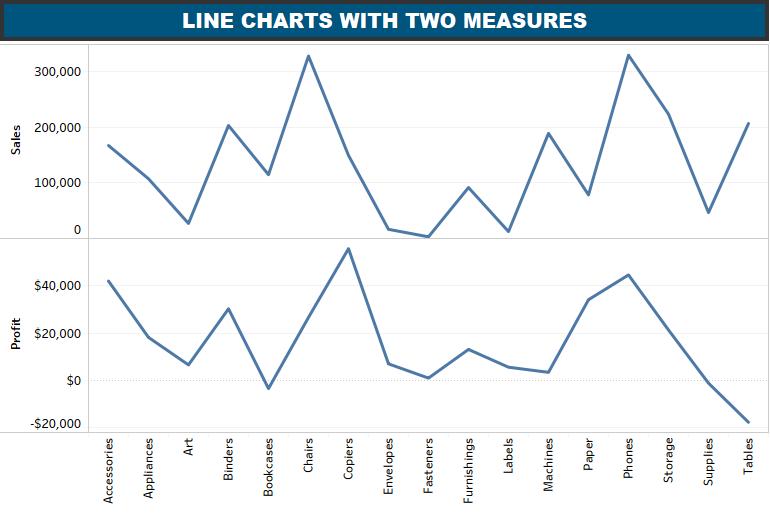
Multiple Measure Line Chart
You can use one dimension with two or more measures in a line chart. It will produce various line charts, each in one pane. Each pane signifies the dissimilarity of the dimension with one of the measures. See below
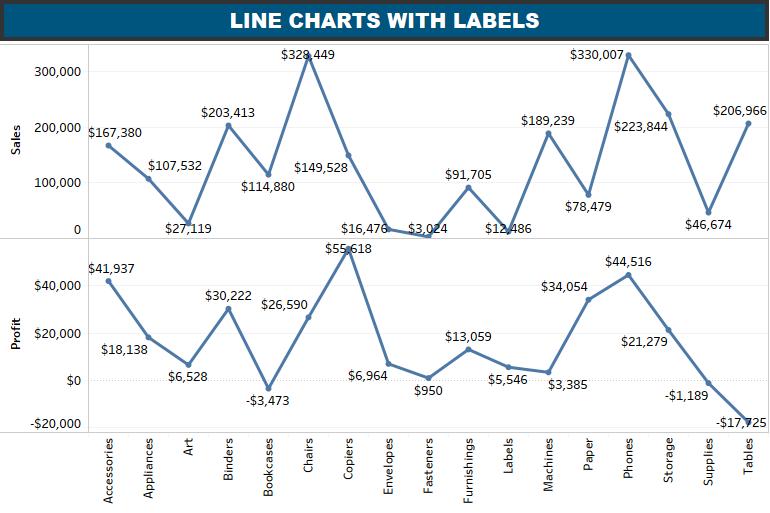
Line Chart with Label
Each of the points making the line chart can be labelled to make the values of the measure visible. In this case, drop another measure Profit Ratio into the labels pane in the Marks card. Choose average as the aggregation, and you will get the following chart showing the labels.
With this in mind, I am sure you’ll be able to create any line chart in Tableau.
Also, Try answering these Tableau multiple-choice questions quiz and exams to test your skills in the Tableau.
- Tableau Desktop Specialist Practice Questions for Global Certification (Practice quiz)
- Tableau Desktop Specialist (Practice Exams)
If you have any questions, please shoot an email to info@datavizguru.com





One Reply to “Line chart in Tableau: Creation & Importance”