
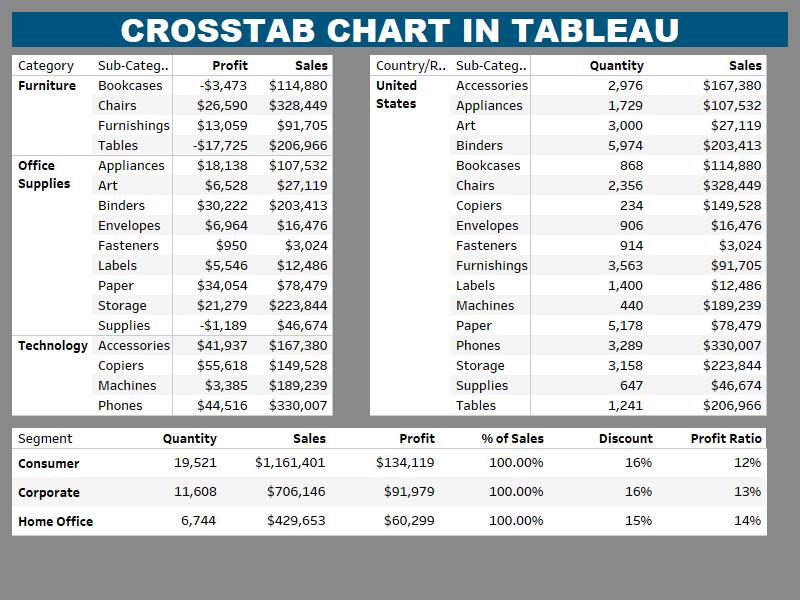
Popularly known as a Text table or Pivot view. This is used as a short term for cross-tabulation. Cross Tab chart shows the data in textual form. It shows the actual value of any dimension in the data. It is also defined as a series of rows and columns that consist of headers and numeric values. The type of view is made up of one or more dimensions and or more measures. This chart has the feature to show differed calculations on the values of the measured field, for example, running total, percentage total, etc.
Let’s say you use the Sample-superstore, to get results for sales for each segment in each region. For this, you will have to depict this data for every single year by utilizing the order dates. Mentioned below are the steps to create a crosstab:
Firstly, drag and drop the dimension order date to the columns shelf and then you need to drag and drop the dimensions region and segment to the rows shelf. Now, pull the measure Sales to the labels Shelf under Marks.

Once you follow these steps, you will see the resultant cross tab chart. You can also use colors and get the values color encoded in the crosstab. This color-coding shows the forte of the color subject on the value of the measure. The larger amounts have a darker shade than the lighter values.
Also, in color encoding, you can get calculations applied to the values from the measure. Let’s say in this example; we have used the calculation to find the percentage total of sales for each row instead of only the sales figures. For this, you can right-click on SUM (Sales) present in the marks card and choose the option Add Table Calculation. You will then need to select the percent of the total and summarize it as Table.

Cross Table is one new type of chart through which we can easily display the actual data in numbers.


