Tableau is among the most popular Business Intelligence tools that are used by companies. Any professional or amateur will be able to state the creativity this tool has. It is a data interpretation tool in the form of visuals used by decision-makers of many organizations. It is an introductory post to showcase this. This run-through will give you a sharp insight into how this tool functions.
If you want to make a sparkling career in Data Science, then getting trained on Tableau by PST Analytics comes highly recommended!
Let us get started!
Let us get started!
Advanced Graphs
Graphs and charts are core how a Data Scientist to work. Let us begin by studying what all types of figures and tables are present in Tableau!
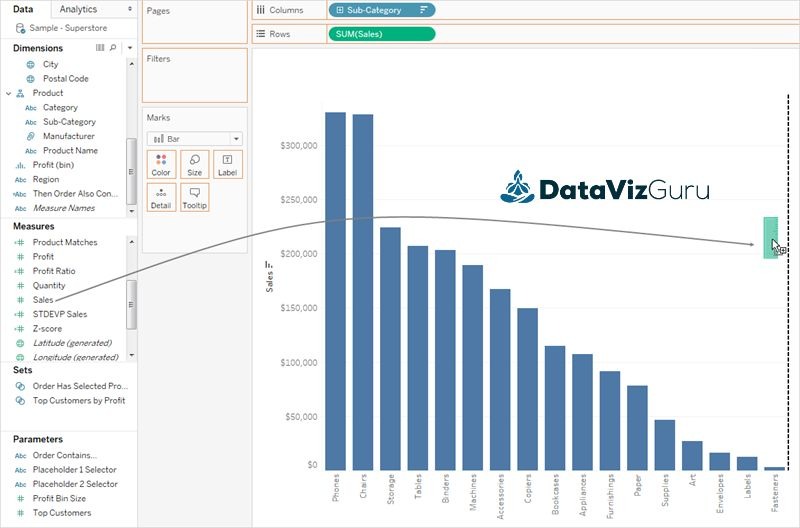
In Tableau Dashboard, there is a ‘Show Me’ feature for generating more straightforward charts with fewer calculations. For advanced users who need to calculate complex data, they need to go beyond it. Some of the problematic and engaging graphs that you can create in Tableau are below:
Motion Chart

These are attractive, lively line graphs that you can create in Tableau. These are often used for analysis to compare trends, especially in market positions.
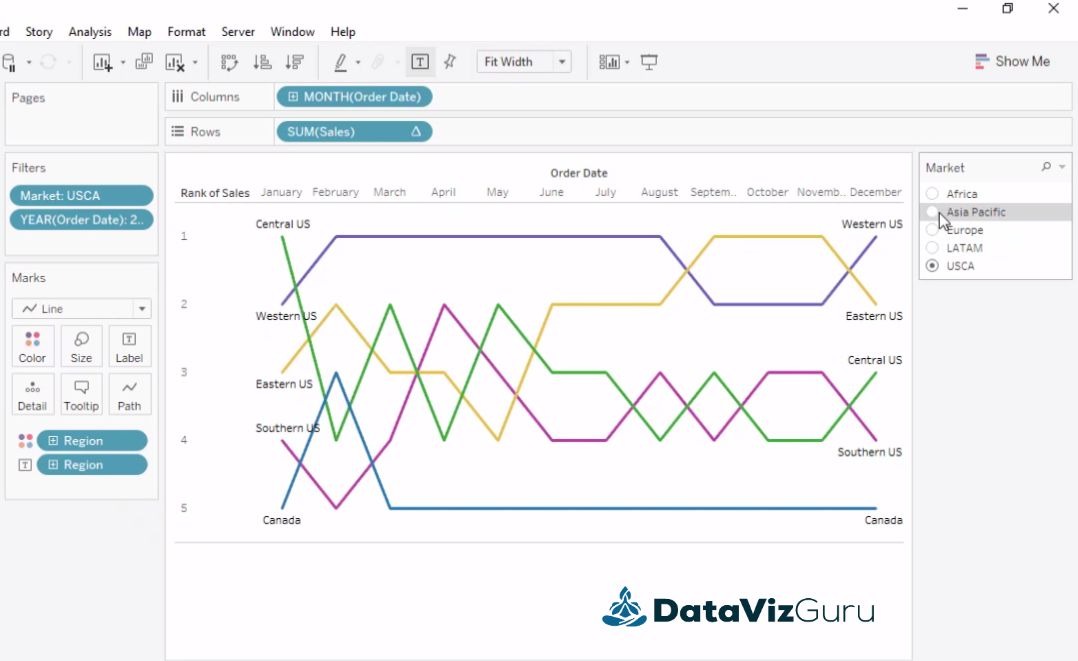
Bump Chart

Commonly used for segment examination (for example, sales of products from different categories), bump charts display a much precise picture than the line charts. They show themes of contra flection or intersection of the line in an easily readable form.
Doughnut Chart

It is one classy representation of numbers. A doughnut chart is an enhanced version of a pie chart. In the middle, it has a hole which makes it easier to read.
Waterfall Chart

Like a waterfall, this chart mostly represents numbers that are running (like, running sales of a company year by year). It effortlessly depicts increase and drip trends, which makes it simple to spot any movement in the pattern.
Pareto Chart

Pareto charts come into picture when you need to determine and compute Risk Management. It is to classify the most usual problems that harm a project. Tableau permits the generation of communicating Pareto charts.
☛ Steps to use Tableau for Beginners
How to Install
You only need to do is to download Tableau on your PC and agree to the license agreement for the user. Now you can open the newly installed program, and you can now work on Tableau.
Understanding the Tableau Workspace/Dashboard
The Tableau workspace includes a menu bar, toolbar, shelves, worksheets and many other elements that any user will get acquainted with after working on Tableau over some time. The ‘Sheets’ segment includes dashboards, spreadsheets, and stories where you can find varied projects.
How to integrate a Data Source
Being a Data Analysis tool, Tableau needs data to process, which is enabled by Data Source. Tableau is in tune with a multiple of Data sources. You can quickly check what types of Data sources can be attached by going to the left pane. Tableau can support Text, Excel, or Server Data and more.
Try answering these Tableau multiple-choice questions quiz and exams to test your skills in the Tableau.
- Tableau Desktop Specialist Practice Questions for Global Certification (Practice quiz)
- Tableau Desktop Specialist (Practice Exams)
If you have any questions, shoot us an email at info@datavizguru.com.


